ABOUT
This website lists (unofficial) skill ratings for players of the official Fantasy Premier League (FPL) game.
Key features:
-
based on data going back 13 seasons for all 4.5 million FPL managers who started the 2018-19 season
-
allows comparison between managers with differing career lengths
-
objective method
METHOD - IN BRIEF
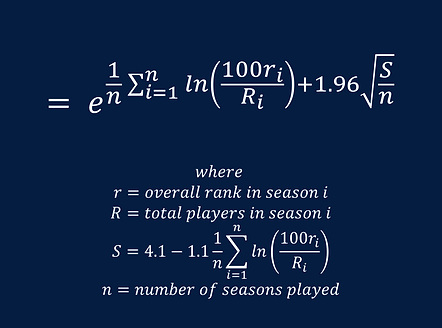
In simple terms, the skill rating takes an average of a player's rankings across all the seasons they've played (since 2006-07) and adds a 'buffer'. The size of the buffer is larger for players who have completed fewer seasons.
The skill rating is equal to the upper bound of the 95% confidence interval for the geometric mean of a player's percentiles across all seasons (where, for example, an overall rank of 10 000 in a season with 1 000 000 players is a percentile equal to one).
METHOD - IN DETAIL
The problem of how to aggregate several ranking lists into one ranking has been studied extensively. Until recently it focused on aggregating many short lists, such as electoral voting. Recently there has been a focus on aggregating a small number of long lists for web search and genomic applications. FPL season rankings are another example of a small number of very long lists.
A simple method that has been found to perform reasonably well is the geometric mean (e.g. Li et al 2019). This is calculated for each manager by taking logs of each season rank, averaging the logs, and then taking the anti-log (or exponential) of the average.
Two of the key challenges when rating the skill of FPL managers are
-
how to weight the performance in more or less recent seasons; and
-
how to compare managers with different career lengths.
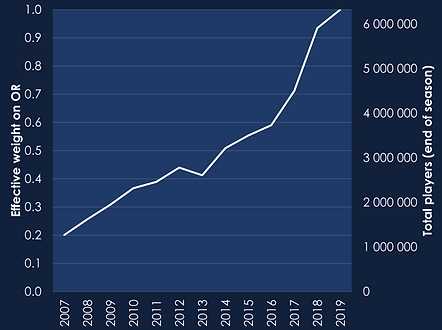
This skill rating converts the season ranks to percentiles, which is effectively the same as weighting the season ranks by the total number of managers playing the game in each season. In principle, there is a case for further weighting towards more recent seasons as predictors of current skill, but this may already be achieved in practice since anecdotally more recent season player numbers are artificially inflated by duplicate teams and teams created for one-off gameweeks. In 2018-19, there were 6.3 million teams by the end of the season, up from 4.5 million in the first gameweek.
There is a lot of variation in manager performance from year to year. So, if a manager gets a top 0.1% finish in their first two seasons, we are much less confident that they will be able to repeat the performance next season than we are about a manager who has averaged top 0.1% over ten seasons.
This is the concept of sampling uncertainty. Confidence intervals are used to describe the sampling uncertainty around averages. As sample size increases, we become more certain about what the sample is telling us and the confidence interval narrows.
This skill rating is calculated as the upper bound of the 95% confidence interval for the geometric mean percentile. It assumes a common relationship between variance and average log percentile across all managers.
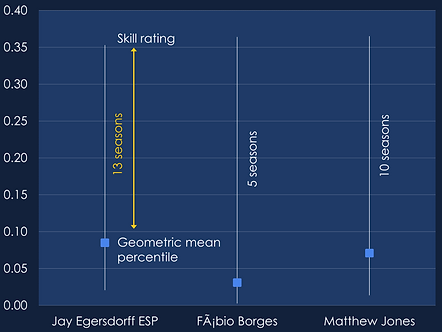
If two managers have the same geometric mean, the manager who has played more seasons is rated more highly. For example, Jay Egersdorff has a slightly better skill rating than Fabio Borges, despite Fabio having a better geometric mean percentile, because Jay has played 13 seasons to Fabio's five.
Thanks go to Ashutosh Pathak who wrote the script for data scraping.